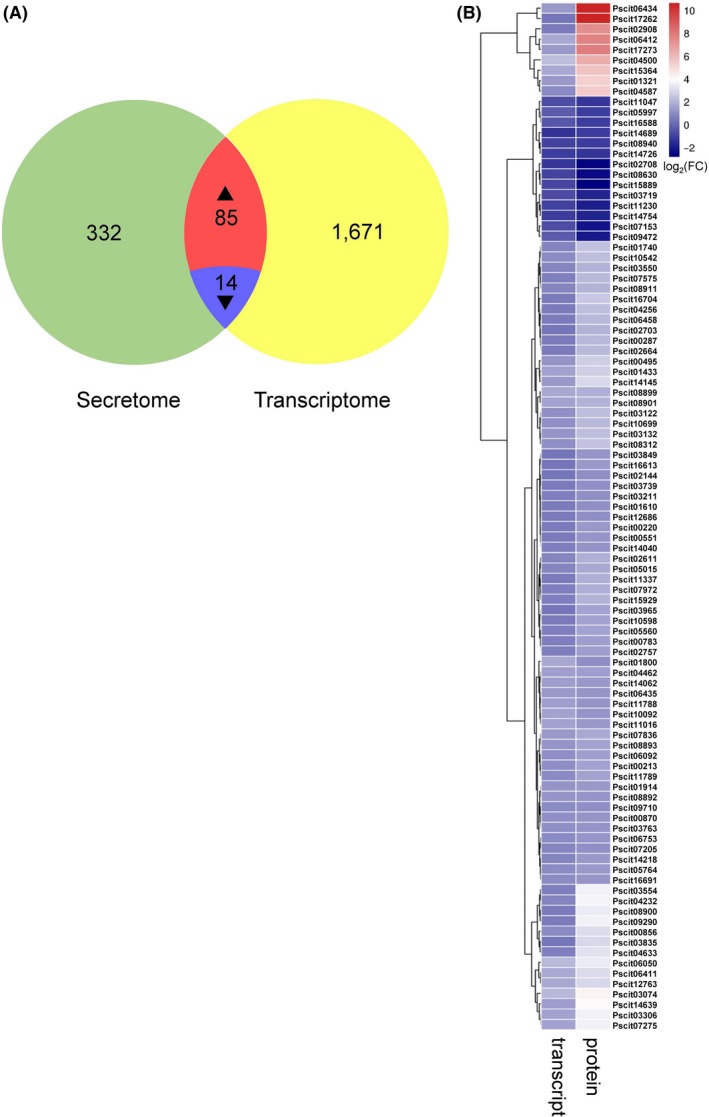
Figure 4.

Expression dynamics and comparative analyses of differentially expressed proteins (DEPs) and differentially expressed genes (DEGs) in Pseudofabraea citricarpa.
A. Venn diagram showing the regulated genes between the protein level and transcript level; (B) heatmap of genes with consistent expression trends in the secretomic and transcriptomic data of P. citricarpa. The P‐values of the 99 DEPs that satisfied fold change ≥ 1.2 between each sample were adjusted to < 0.05. The false discovery rates (FDRs) of the 99 DEGs satisfying fold change ≥ 2 between each sample were < 0.05.
