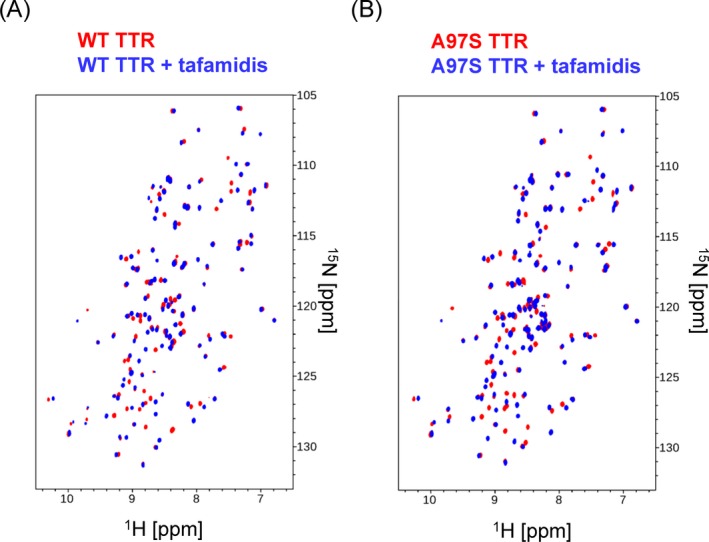
Figure 2.

NMR spectroscopic characterization of Tafamidis binding to wildtype transthyretin and A97S transthyretin. (A) 2D TROSY HSQC spectra of 15N labeling WT‐TTR with (blue) and without (red) the presence of tafamidis at 2.5:1 molar ratio (tafamidis to protein). (B) 2D TROSY HSQC spectra of 15N labeling A97S‐TTR with (blue) and without (red) the presence of tafamidis at 2.5:1 molar ratio (tafamidis to protein).
