
Fig. 3.
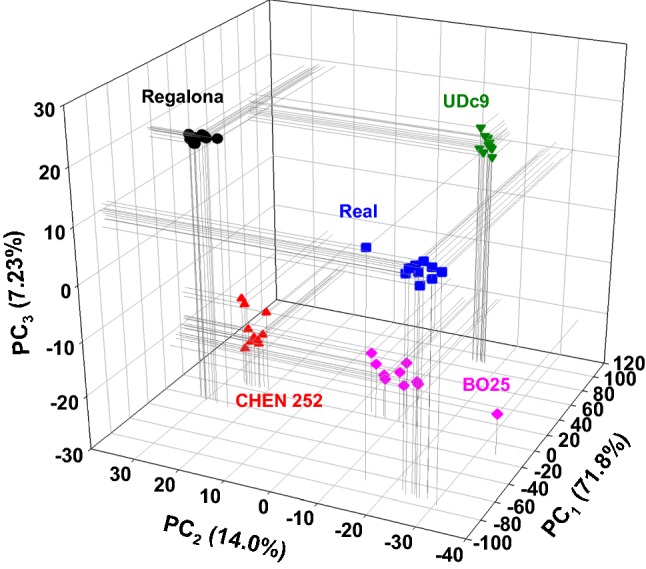
3D scatter plot of the three first components obtained as outcomes from PCA of FT-MIR and FT-NIR spectra: Real (blue squares), CHEN 252 (red triangles up), Regalona (black circles), BO25 (pink diamonds) and UDc9 (green triangles down). In brackets are the variance amounts associated with each component (color figure online)