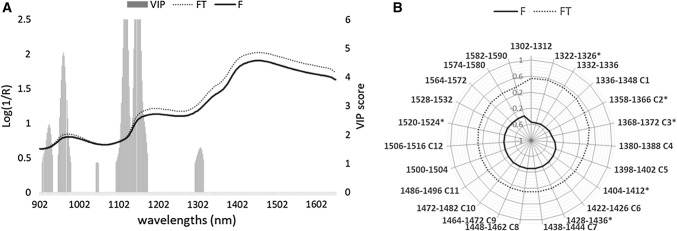
Fig. 4.
a Raw near-infrared spectra of fresh and frozen-thawed cuttlefish. Variable importance in projection VIP scores (gray bars) > 1 were derived by the 2nd derivative model of partial least squares discriminant analysis. b Aquagram of average normalised absorbance values proposed for fresh (F) and frozen-thawed (F-T) cuttlefish (raw spectra). The canonical twelve Water matrix coordinates WAMACS were reported according to the code proposed by Tsenkova (2009) from C1 to C12. An asterisk highlights the characteristics water bands selected in the present study

