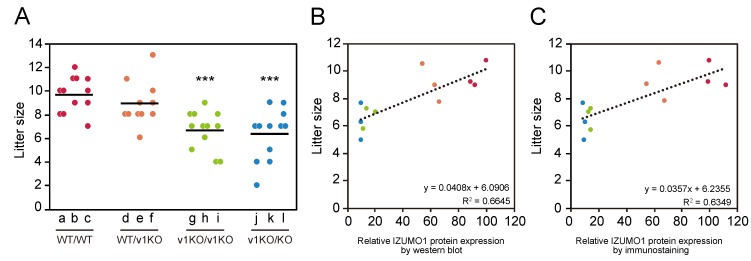
Figure 3.
Comparison between litter size and IZUMO1 protein levels. (A) Litter size of mice mated with B6D2F1 female mice. Each lane represents an individual score from the four mouse lines. Each alphabetical letter corresponds to the same male individuals as in Figure 1A. The average litter size of each mouse line (total number of pups/total number of births) is indicated by the black bar. Significant differences: *** p < 0.001 (Student’s t-test) compared to WT/WT. Correlation of litter size and IZUMO1 expression levels determined with western blot (B) and immunostaining (C). The color scheme is the same as that in Figure 1B.

