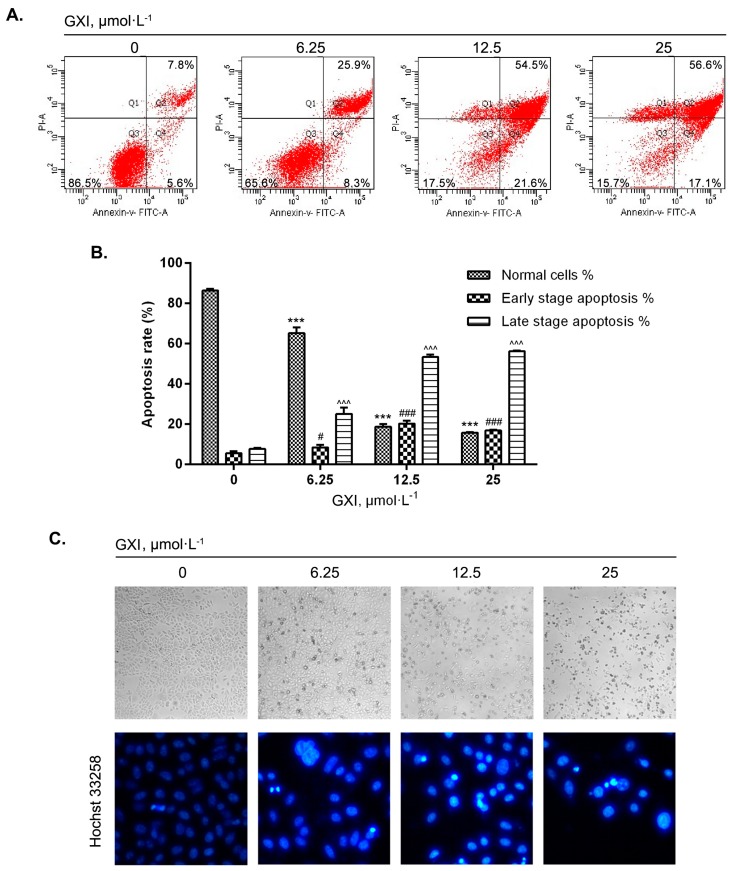
Figure 2.
GXI-induced HepG2 apoptosis. (A) Apoptosis effects of dose-dependent treatment of GXI in HepG2 cells detected by Annexin V-FITC/PI staining. HepG2 cells treated with various doses of GXI for 12h. (B) Fold change of Annexin V-FITC/PI staining. Data represent mean ± SD. For normal cells, *** p < 0.001 compared with control, for early-stage apoptosis, # p < 0.05, ### p < 0.001 compared with control, for late-stage apoptosis, ^^^ p < 0.001 compared with control. (C) Morphological changes after treatment with various doses of GXI for 24 h analyzed by direct microscopy examination in 100× and Hochst 33258 fluorescent staining in 400×.

