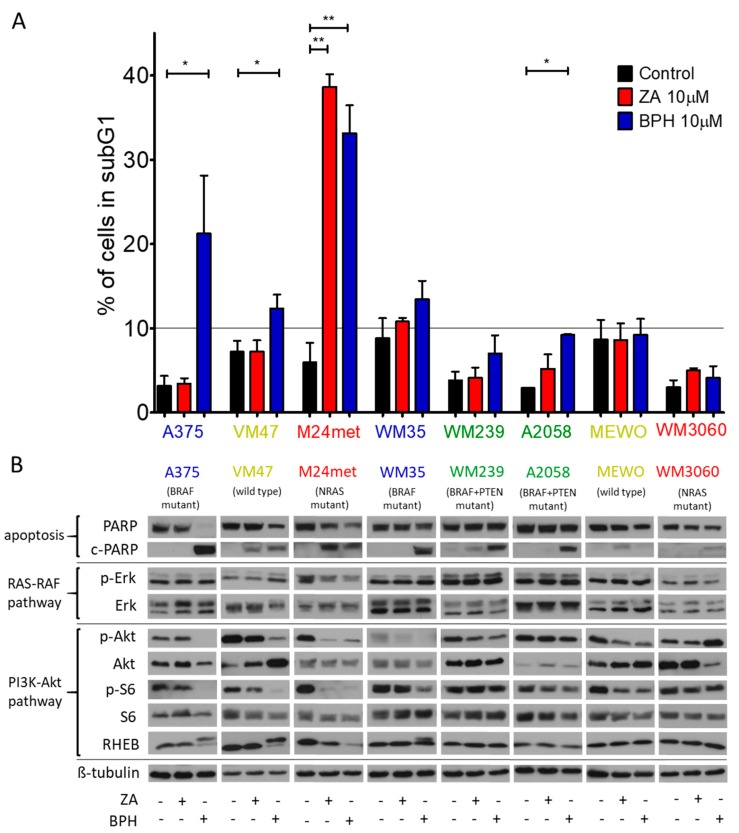
Figure 3.
(A) The cell cycle distribution was examined after 72 h of treatment with 10 µM ZA or BPH. In most cell lines, BPH increased more strongly the ratio of cells in the subG1 phase except for the M24met cell line. Data are shown as the average ± SD from two or three measurements. Asterisks mean a significant difference between the control and treated groups by * p < 0.05 and ** p < 0.01. (B) Western blot analysis was performed to detect the apoptosis induction and protein activation after 48 h-long treatment with 10 µM ZA or BPH. C-PARP was detected in most of the cell lines, particularly after treatment with BPH. Levels of total and phosphorylated Akt, S6, and Erk, as well as Rheb and c-PARP/PARP protein were analyzed. β-tubulin was used as the loading control. In the majority of the cell lines, activation of S6 and/or Akt decreased especially after BPH treatment, while Erk activation did not change substantially. The Rheb protein level was modified by BPH treatment in four cell lines (A375, WM35, VM47, M24met). Immunoblots are representative images from at least three independent measurements. The colors of the cell names represent the mutational group of the cells as BRAF (blue), BRAF + PTEN (green), NRAS mutant (red), and BRAF + PTEN + NRAS wild-type (yellow).

