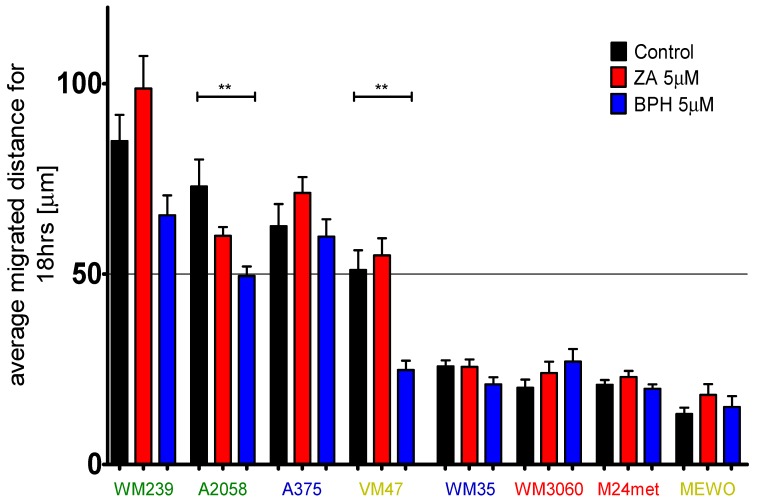
Figure 4.
Average migrated distance of melanoma cell lines upon treatment with 5 µM ZA or BPH was measured by time-lapse video microscopy. Cell lines were divided into two groups according to their baseline migratory capacity. The faster lines were more sensitive to the treatment with BPH than ZA. Moreover, ZA could cause an adverse effect on migration. Slower lines were insensitive to the treatment. Blue, green, red, and yellow colors indicate the mutation status of the cells, as the BRAF mutant, BRAF + PTEN mutant, NRAS mutant, and BRAF + PTEN + NRAS wild-type, respectively. Data are shown as the average of the migrated distance for 18 h ± SEM from at least two independent measurements and three non-overlapping microscopic fields. Asterisks mean a significant difference between control and BPH by ** p < 0.01.

