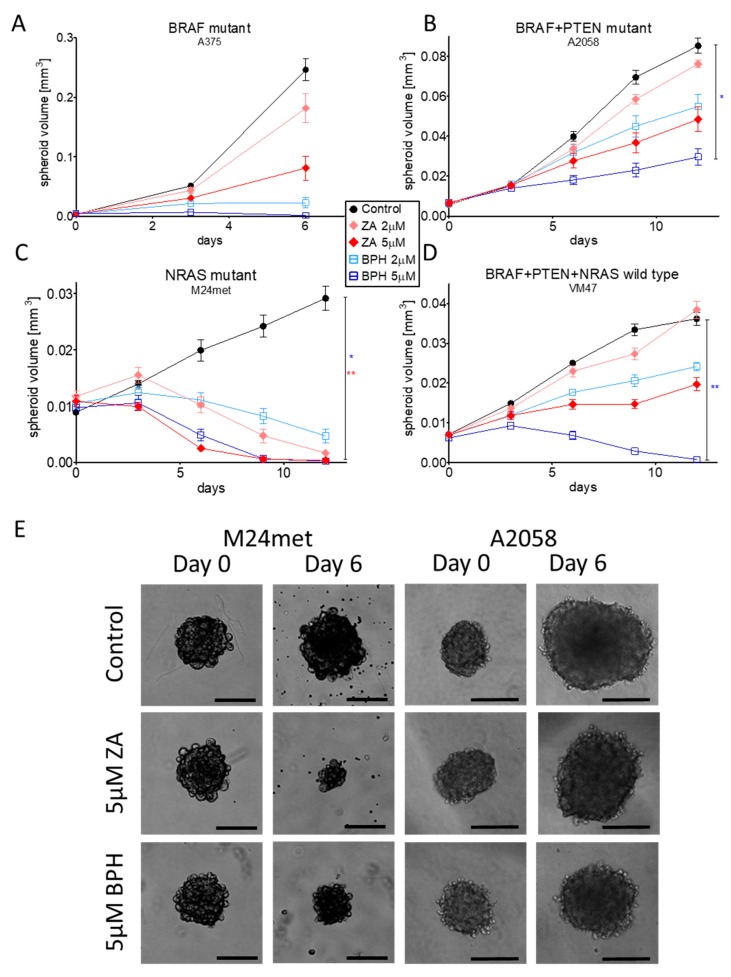
Figure 5.
Three-dimensional spheroid growth experiment was performed to compare the effect of ZA and BPH. In the case of A375, A2058, and VM47 cell lines (A,B,D), BPH had a stronger effect compared to ZA, while the M24met cell line was more sensitive to ZA (C). Data are shown as the average ± SEM from at least two independent experiments. Asterisks mean a significant difference between the control and BPH (blue star) or ZA (red star) by * p < 0.05 and ** p < 0.01. (E) Representative pictures show the effect of the inhibitors on the sixth day after treatment with 5-µM ZA or BPH. Scale bar means 200 µm.

