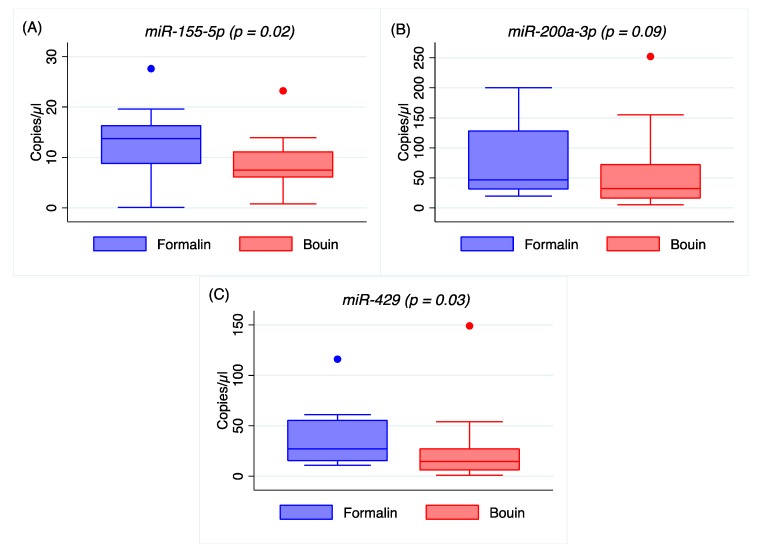
Figure A3.
Box plot representing quantitative reverse transcription polymerase chain reaction (RT/ddPCR) of miR-155-5p (A), miR-200a-3p (B), and miR-429 (C) in matched formalin- and Bouin’s-fixed tissues by ddPCR. The box represents the first and third quartiles, intersected by the median, and the whiskers are the range.

