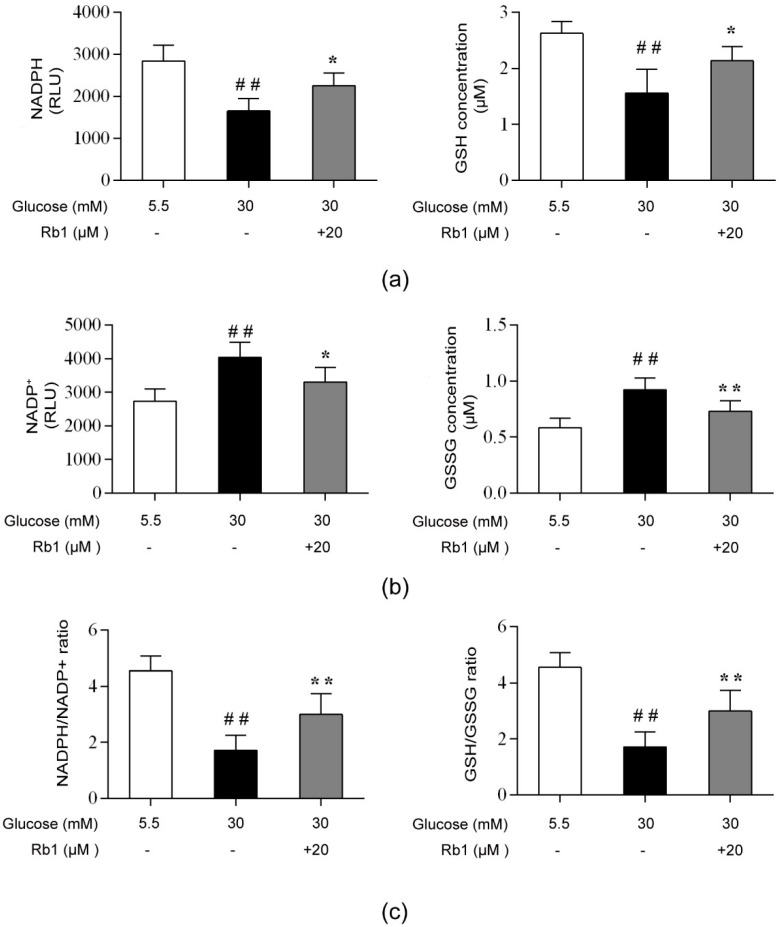
Figure 8.
Rb1 modulated the NADPH/NADP+ and glutathione (GSH)/GSSG ratios in RCECs exposed to high glucose. (a) NADPH and GSH levels. (b) NADP+ and GSSG levels. (c) NADPH/NADP+ and GSH/GSSG ratios. Data are expressed as the means ± SD. ## p < 0.01 versus 5.5 mM glucose; * p < 0.05 and ** p < 0.01 versus 30 mM glucose.

