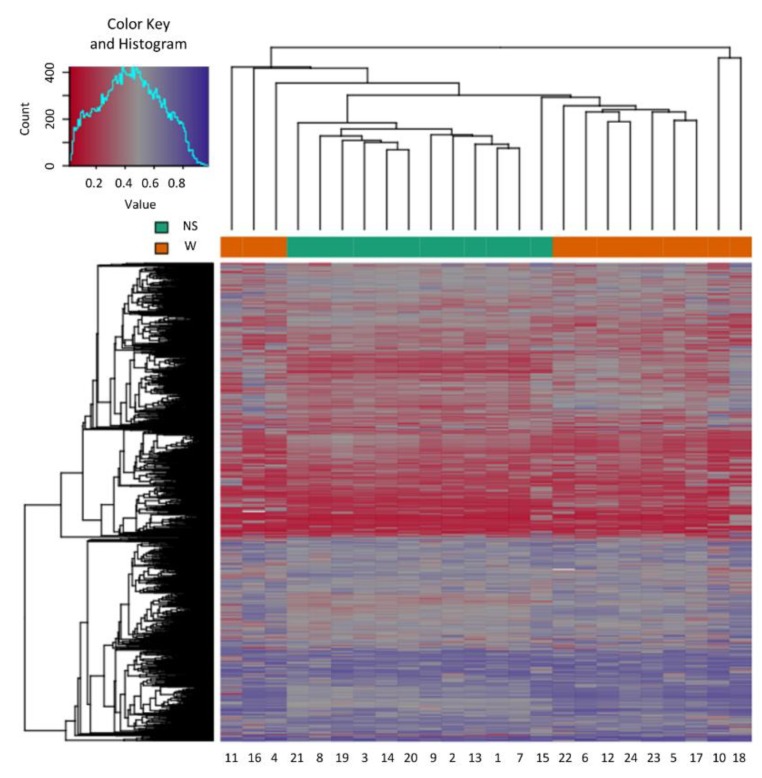
Figure 1.
Heatmap showing the hierarchal clustering of the 1000 most variable loci with the highest variance across the wart (W) and normal skin (NS) samples. Clustering incorporated average linkage and Manhattan distance. The numbers at the bottom horizontal axis (1 to 24) stand for the patient samples.

