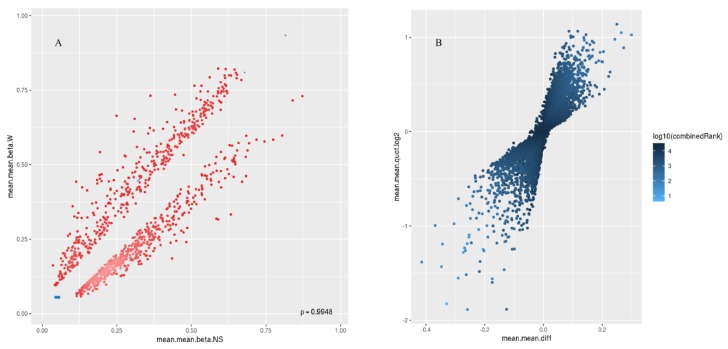
Figure 4.
Scatterplot (A) and volcano plot (B) analysis for the top 1000 most differentially methylated CpG islands. In (A), the mean of mean methylation levels (beta value) for normal skin across all sites in a region (mean.mean.beta.NS) is on the x axis, and the mean of mean methylation levels (beta value) for warts across all sites in a region (mean.mean.beta.W) is on the y axis. Methylation beta values ranged from 0 (unmethylated) to 1 (fully methylated). In (B), the figure illustrates the overall extent of hypermethylation (>0) and hypomethylation (<0) of the top 1000 most differentially methylated CpG islands. Differential methylation was quantified by log2 of the mean quotient in means across all sites in a region (mean.mean.quot.log2) and the mean difference in means across all sites in a region (mean.mean.diff) between W and NS.

