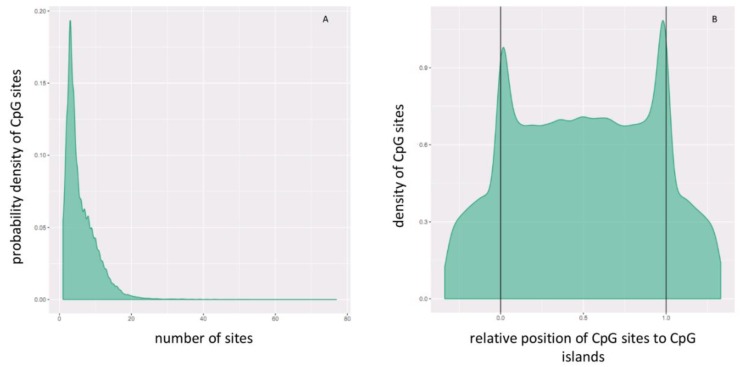
Figure 6.
CgG site distribution (A) per and (B) across CpG islands. In panel B, the relative coordinates of 0 and 1 correspond to the start and end coordinates of each CpG island. Coordinates smaller than 0 and greater than 1 denote flanking regions normalized by region length. CpG sites are more dense at the start and end of CpG islands.

