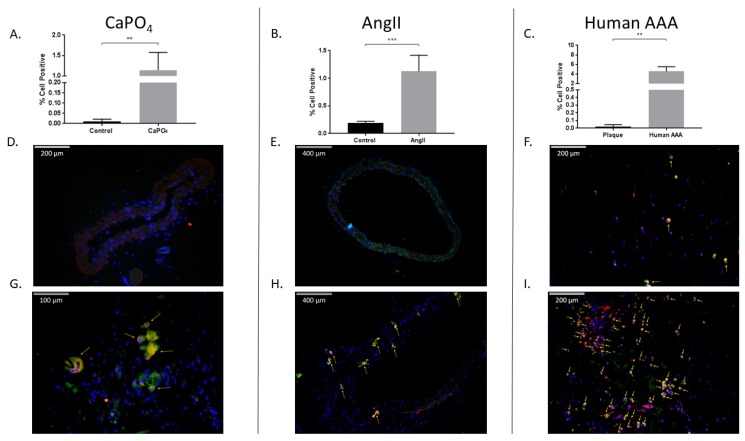
Figure 6.
Mouse and human aneurysms contain more TPMs than non-aneurysmal control tissues. Mouse CaPO4 (A), mouse AngII (B), and human (C) aneurysms exhibit more TPMs (cells double-positive for expression of the myeloid marker, CD11b, and the osteoclast marker, TRAP) than respective controls. (A–C) show TPMs as a percentage of live cells in tissues from CaPO4 mice (n = 5) (A), AngII mice (n = 6) and PBS-only controls (n = 3) (B), human AAA (n = 4) and human carotid plaques (n = 3) (C). Tissues were enzymatically digested and processed to obtain single-cell suspensions for flow cytometric analysis, as described in the Methods section. (D–I) Immunofluorescence staining of frozen control and aneurysmal sections. Control sections (D–F), and aneurysmal sections (G–I) were stained for CD11b (red), TRAP (green), and DAPI (blue) as described in the Methods section. Yellow arrows indicate TPMs. 100× magnification (E,H), 200× magnification (D,F,I), 400× magnification (G). Data are expressed as mean ± SEM. ** p < 0.01, *** p < 0.001. TPM, TRAP-positive macrophage. AAA, abdominal aortic aneurysm.

