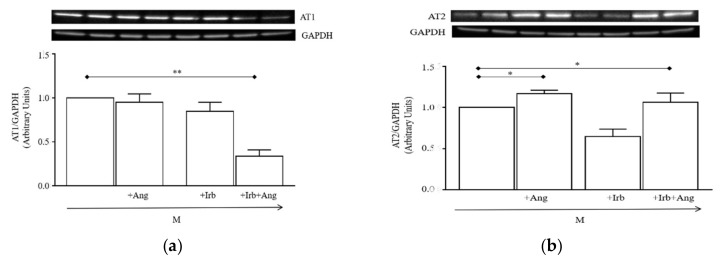
Figure 6.
Effect of sub-chronic Ang conditioning of hSCs on expression of AT1 and AT2 receptors: (a) Representative immunoblotting (top) and densitometry analysis (bottom) of AT1 receptors expressed in hSCs cultured for 24 h in the M supplemented or not with 100 nM Ang, 1 µM Irb, or Ang plus Irb (Ang + Irb); (b) representative immunoblotting (top) and densitometry analysis (bottom) of AT2 receptors expressed in hSCs cultured as in (a). Densitometry analysis is reported as ratios between the levels of the target protein and GAPDH. Results are presented as mean ± SEM of the three gels. * p < 0.05 vs. M, ** p < 0.01 vs. M.

