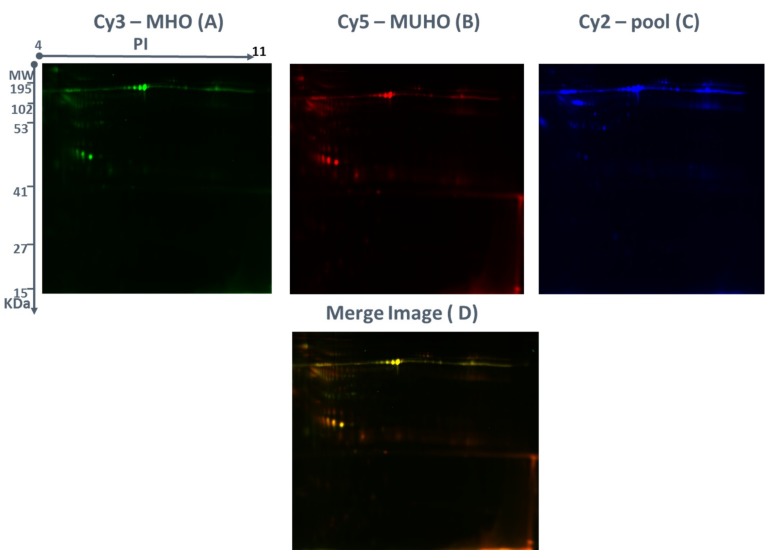
Figure 1.
Representative fluorescent protein profiles using two-dimensional difference in gel electrophoresis (2D-DIGE) containing (A) a metabolically unhealthy obese (MUHO) sample labeled with Cy5, (B) a metabolically healthy obese (MHO) sample labeled with Cy3, and (C) a pooled internal control labeled with Cy2. Proteins were separated on IPG strip (pH 3–11) in the first dimension followed by 12.5% PAGE in the second dimension electrophoresis. Images were captured using a Typhoon 9400 Variable Mode. (D) An overlay of Cy3/Cy5 images is shown.

