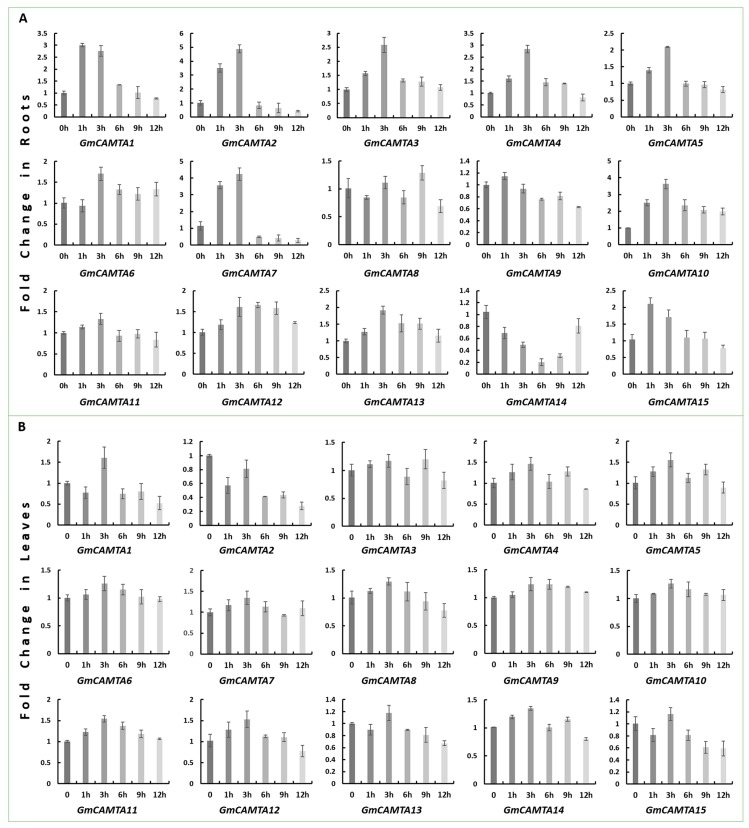
Figure 4.
Spatiotemporal expression analysis of GmCAMTA in drought. (A) Relative fold expression of GmCAMTAs in Roots. Soybean plants were treated with 6% PEG6000 in Hoagland’s solution for five different durations (1, 3, 6, 9 and 12 h) along with a control (0 h). (B) Relative fold expression of GmCAMTAs in Leaves.

