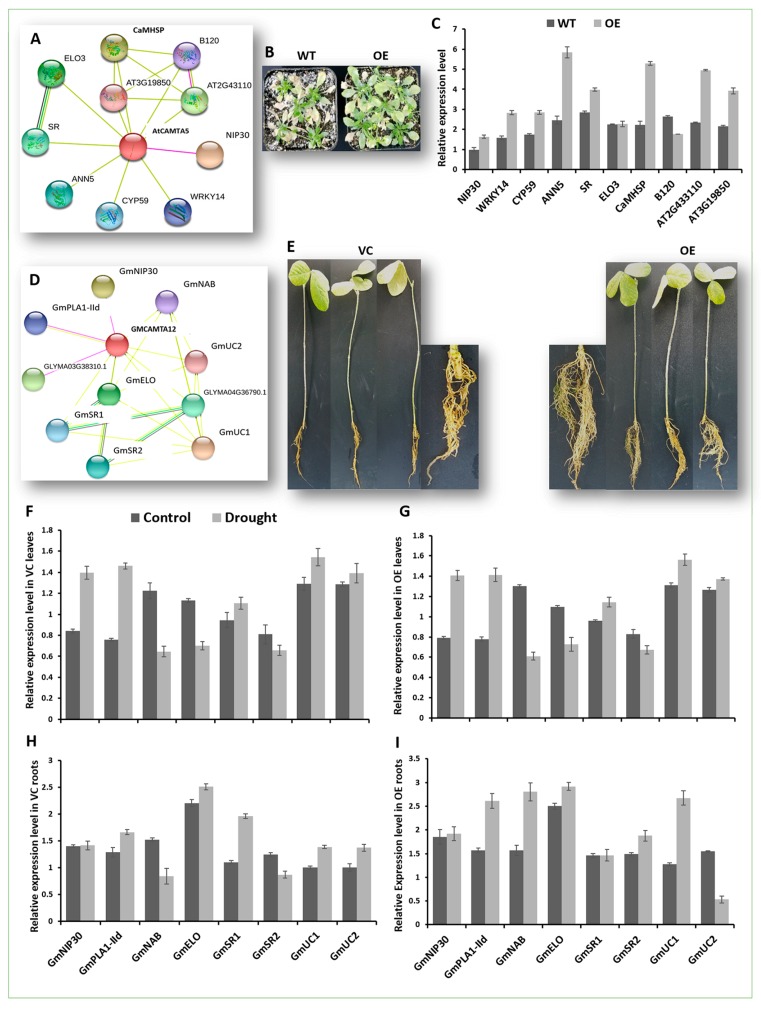
Figure 7.
Expression analysis of genes in the regulatory network of GmCAMTA12 and AtCAMTA5. (A) STRING-predicted regulatory network of AtCAMTA5. (B) Drought treated WT and OE Arabidopsis. (C) Expression profile of the 10 interactors of AtCAMTA5 in WT and OE Arabidopsis. (D) STRING-predicted regulatory network of GmCAMTA12 in soybean. (E) Chimeric soybean plants with VC and OE hairy roots. (F) Expression analysis of the eight interactors of GmCAMTA12 in VC and (G) OE leaves. (H) Expression analysis of the eight interactors in VC and (I) OE roots.

