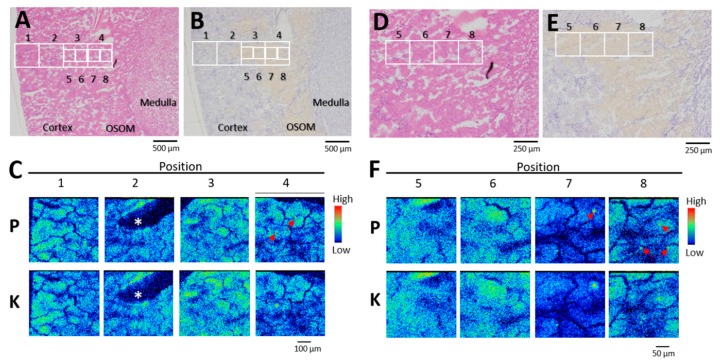
Figure 2.
Phosphorus and potassium distribution in kidney on day 1 post-administration of uranyl acetate (UA) (2 mg kg−1). (A,D) Serial sections stained with hematoxylin and eosin. (B,E) Serial sections stained for glutamine synthetase. Yellow tubules, S3 segments of the proximal tubule. (C) Elemental imaging (scanned area, 500 μm × 500 μm; integrated current, 0.2 μC; beam size, 1 μm × 1 μm) in boxed areas 1–4 (A and B). (F) Elemental imaging (scanned area, 250 μm × 250 μm; integrated current, 0.2 μC; beam size, 1 μm × 1 μm) of boxed areas 5–8 (D and E). P, phosphorus; K, potassium. Arrows, phosphorus concentrated areas. *Artificial crack. The periphery of the renal cortex is on the left side of all images.

