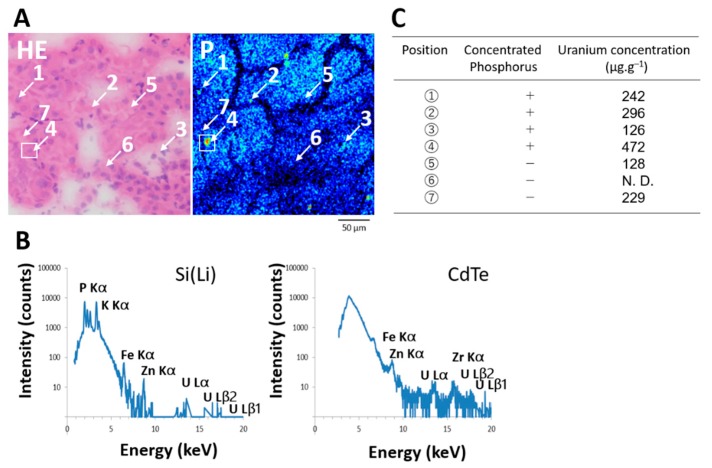
Figure 5.
Quantitative local analysis of uranium in areas with and without concentrated phosphorus in the S3 segments of the proximal tubules on day 1 post-administration of UA (2 mg kg−1). (A), Analytical points for PIXE with microprobe (μ-PIXE) spot analysis (scanned area, 500 μm × 500 μm; integrated current, 0.2 μC; beam size, 1 μm × 1 μm). Points 1–4 and 5–7 with and without concentrated phosphorus, respectively. HE, hematoxylin and eosin. P, phosphorus imaging (scanned area, 250 μm × 250 μm; integrated current, 0.2 μC; beam size, 1 μm × 1 μm). (B), μ-PIXE spectra of boxed area (A) (scanned area, 30 μm × 30 μm; integrated current, 0.2 μC; beam size, 1 μm × 1 μm) with Si (Li) and CdTe detectors. Zr was from materials of CdTe detector. (C), Uranium values in areas (A) with and without concentrated phosphorus. N. D., not detected.

