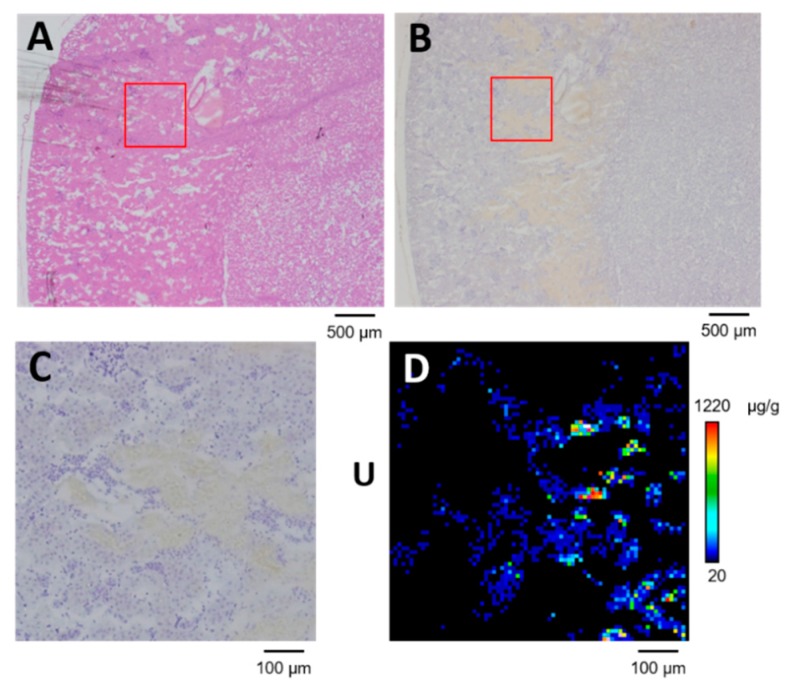
Figure 6.
Uranium distribution in OSOM of kidney with scattered concentrated phosphorus on day 1 post-administration of UA (2 mg kg−1). (A) Serial section stained with hematoxylin and eosin. (B) Serial section immunostained for glutamine synthetase. (C) High-resolution image of boxed area in (A) and (B). (D) Uranium imaging (75 × 75 steps at 10 μm per step; beam size, 1 μm × 1 μm). The periphery of the renal cortex is on the left side of all images.

