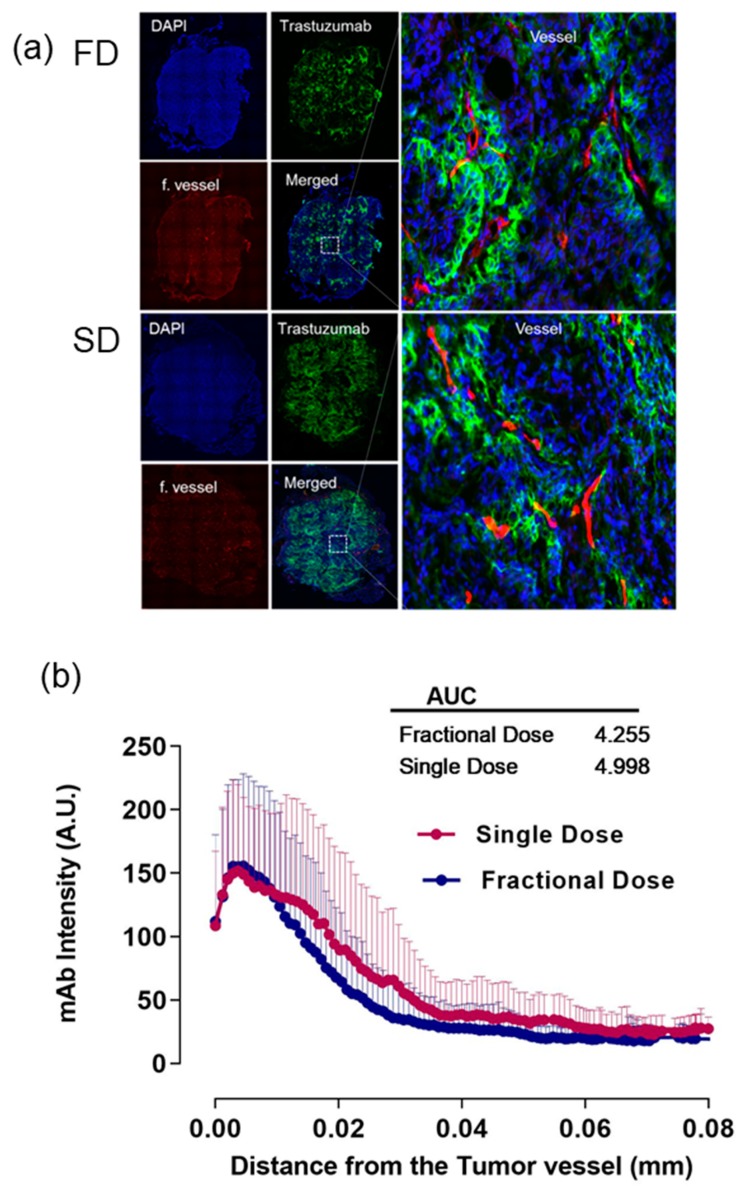
Figure 2.
Representative images of SD and FD. (a) DAPI (4′,6-diamidino-2-phenylindole) in blue, TRZ (trastuzumab) intensity in green, functional vessel in red, merged images, and zoomed merged area near vessel. (b) Histogram plot shows line profiling comprising mean and standard deviation as error bars (above) of SD (single dose) and FD (fractional dose) with respective AUC values.

