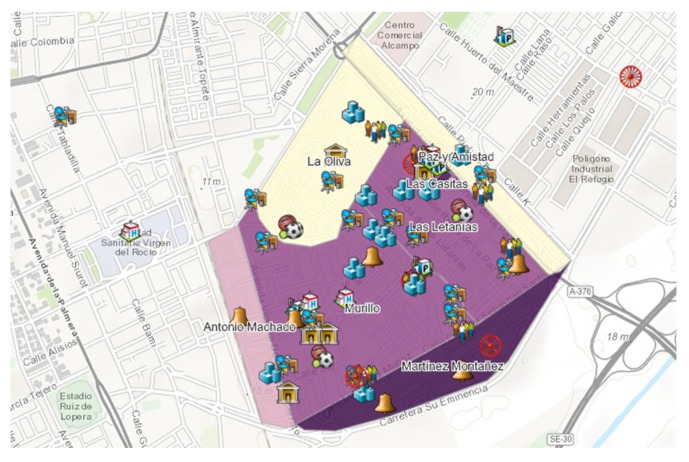
Figure 2.
Screenshot of PS resources through a Roma sensitivity lens. This image shows density of Roma population (represented by darker shades) and identifies resources represented by type. For example, the bell icon represents faith-based organizations, blue centers represent educational services, and red circles represent Roma CBOs. This screenshot reveals that 80% of Roma live nearest two Evangelical churches and furthest away from formal health care services.

