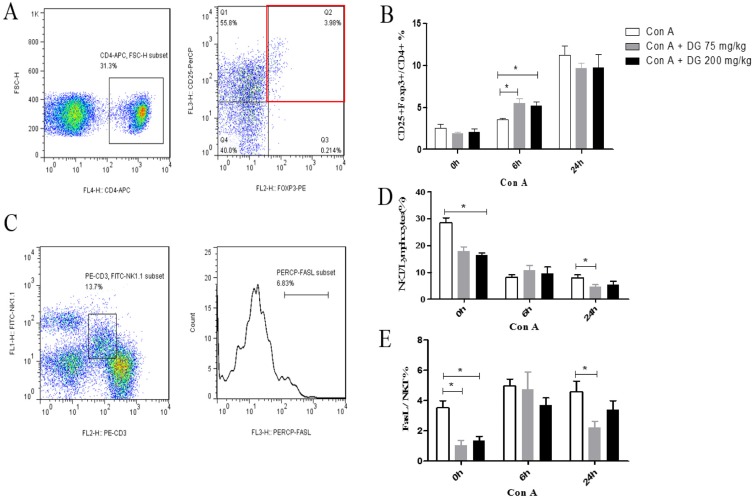
Figure 6.
Pre-treatment with DG infected the frequencies of CD4+CD25+Foxp3+ Tregs and NKT cells in the livers in Con A challenged mice. (A) Analysis of Tregs in the liver. (B) The percentage of the Tregs subset from the liver in Con A-induced immune injury with or without DG pretreatment. (C) Analysis of NKT cells and expression of FasL on the surface of NKT cells in the liver. (D) The percentage of NKT cells from the liver in Con A-induced immune injury with or without DG pretreatment. (E) The percentage of FasL expressed on the surface of NKT cells from the liver in Con A-induced immune injury with or without DG pretreatment. *means P < 0.05. N = 8 for each group. This experiment was performed in triplicate.

