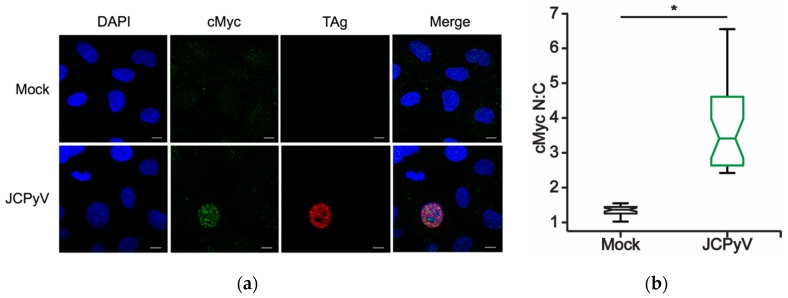
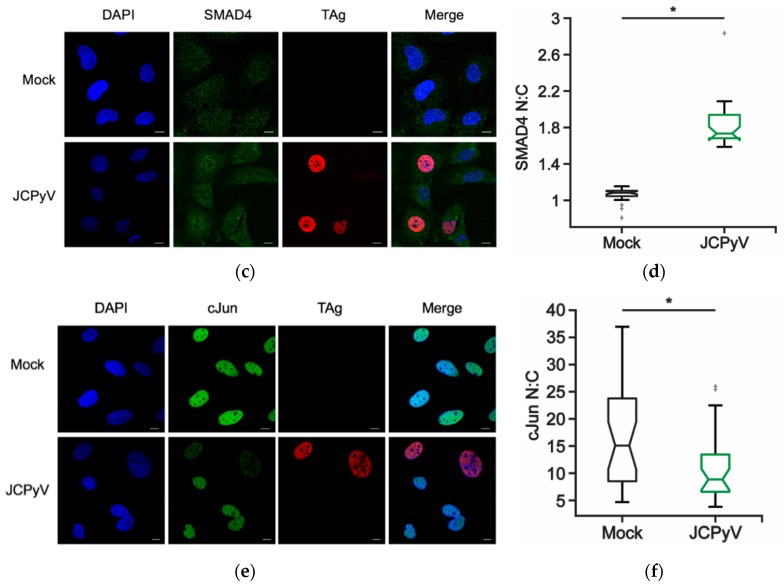
Figure 4.
MAPK-regulated transcription factor localization during JCPyV infection. SVG-A cells were infected with JCPyV (MOI: 2 FFU/cell) and incubated in cMEM at 37 °C for 48 h, then fixed and processed for confocal imaging. Representative confocal images (60x) demonstrating (a) cMyc, (c) SMAD4, and (e) cJun (green) cellular localization patterns during mock or JCPyV infection, as measured by TAg expression (red). Cell nuclei stained with DAPI (blue). Scale bars = 10 μm. Boxplots of N:C ratios for (b) SMAD4, (d) cMyc, or (f) cJun quantified from confocal images of 30 individual cells. Whiskers represent values 1.5 times the distance between the first and third quartiles (inter-quartile range). Boxplot notches denote the 95% confidence interval around the median. Data are representative of N:C ratios from three independent experiments. Wilcoxon sum rank test was used to determine statistical significance. * p < 0.05.


