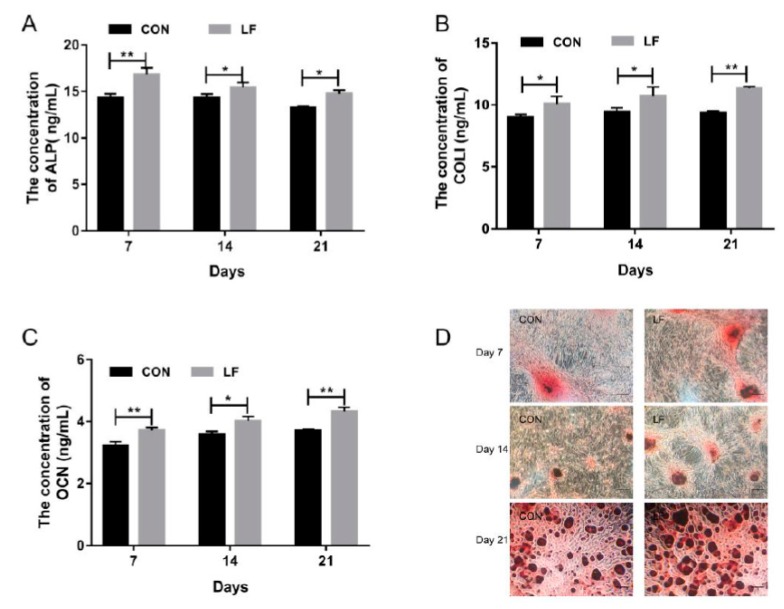
Figure 1.
The osteogenic differentiation capacity of control rBMSCs (CON group) and Lactoferrin (LF)-treated rBMSCs (LF group). (A) Alkaline phosphatase (ALP) activity of rBMSCs on day 7, 14 and 21; (B) COLI expression of rBMSCs on day 7, 14 and 21; (C) Osteocalcin (OCN) expression of rBMSCs on day 7, 14 and 21; (D) Alizarin Red S staining, magnified images of rBMSCs of LF group and CON group (100×) on day 7, 14 and 21. Data are expressed as mean ± SD of three independent experiments (n = 3), the LF group was compared with CON group by unpaired student’s t-test (* p < 0.05, ** p < 0.01).

