Figure 2.
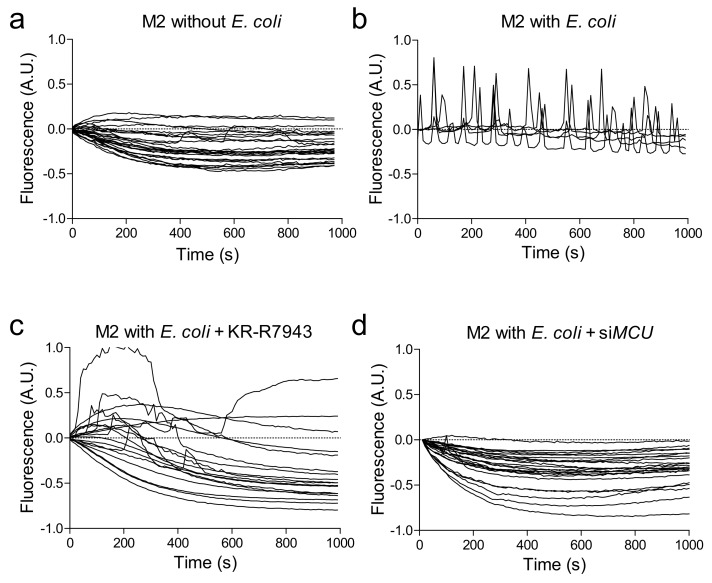
Mitochondrial calcium spikes during phagocytosis. Mitochondrial calcium concentrations, recorded as Rhod-2 fluorescence intensity, were imaged real-time in M2-polarized macrophages in the unstimulated condition (a) and after challenge with E. coli fragments without (b) or with (c) the MCU inhibitor KB-R7943 or transfection with siRNA against MCU (d). In each plot, individual lines represent the fluorescence intensity of regions of interest (ROI) drawn around each macrophage.

