Figure 3.
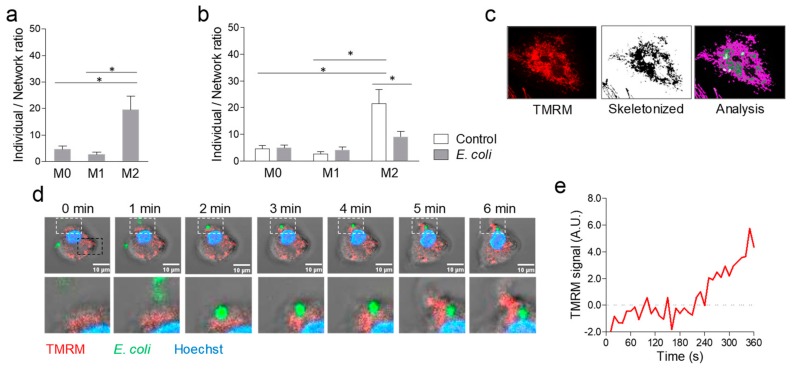
Mitochondrial remodelling during phagocytosis. Using the mitochondrial network analysis (MiNA) tool on macrophages stained with TOMM20, we calculated the ratio between individual macrophages and a macrophage network. (a) Average individual/network ratio in resting (M0), M1-, and M2-polarized macrophages (* p < 0.05 after ANOVA). (b) Average individual/network ratio in resting (M0), M1-, and M2-polarized macrophages before and after challenge with E. coli fragments (* p < 0.05 after 2-way ANOVA). (c) Representative images of a region of interest (ROI, ~40 µ) set around one macrophage to show the pattern of TOMM20 staining, result of the skeletonization procedure after imaging processing, and the analysis with MiNA tool. (d) Time-series obtained during live recording, cropped around a single M2 macrophage ROI (~40 µ), to show internalization of an E. coli fragment. Macrophages were stained with Hoechst 33342 and TMRM. The lower lane of images represents magnifications of the white, dashed insert of images in the upper lane. (e) TMRM fluorescence intensity over time in the white, dashed insert, where E. coli fragment internalization occurred, after subtraction of the TMRM fluorescence intensity in an equal remote ROI (black, dashed line).

