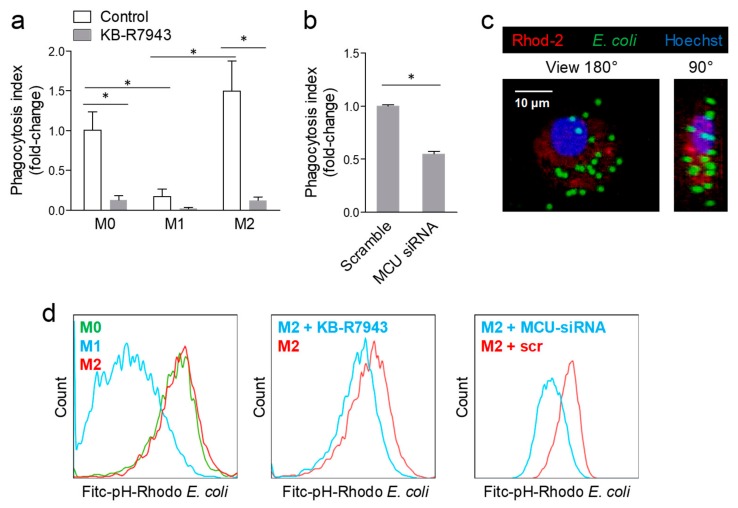
Figure 4.
Blocking MCU inhibited phagocytosis. (a) Phagocytosis of E. coli fragments was quantified using flow cytometry in resting (M0), M1- and M2-polarized macrophages in the control condition or after pre-treatment with the MCU inhibitor KB-R7943 (* p < 0.05 after 2-way ANOVA). (b) Phagocytosis of E. coli fragments was quantified in M2-polarized macrophages transfected with scramble siRNA, or siRNA against MCU (* p < 0.05). (c) Representative 3D reconstruction of z-stacks collected during live imaging of M2 macrophages with confocal multiphoton multicolour microscopy. Cells were stained with the mitochondrial red calcium dye Rhod-2, the nuclear dye Hoechst 33342, while the green fluorescence derives from E. coli fragments (pH-Rhodo). The 180° and 90° rotated images are shown. (d) Representative FACS histograms showing phagocytic capacity of resting (M0), M1- and M2-polarized macrophages, as well as the effects of the MCU inhibitor KB-R7943 or MCU silencing on phagocytosis by M2 macrophages. The histogram shows, for each condition, the fluorescence intensity of the green (Fitc) channel on the x-axis, relative to the normalized cell count on the y-axis.

