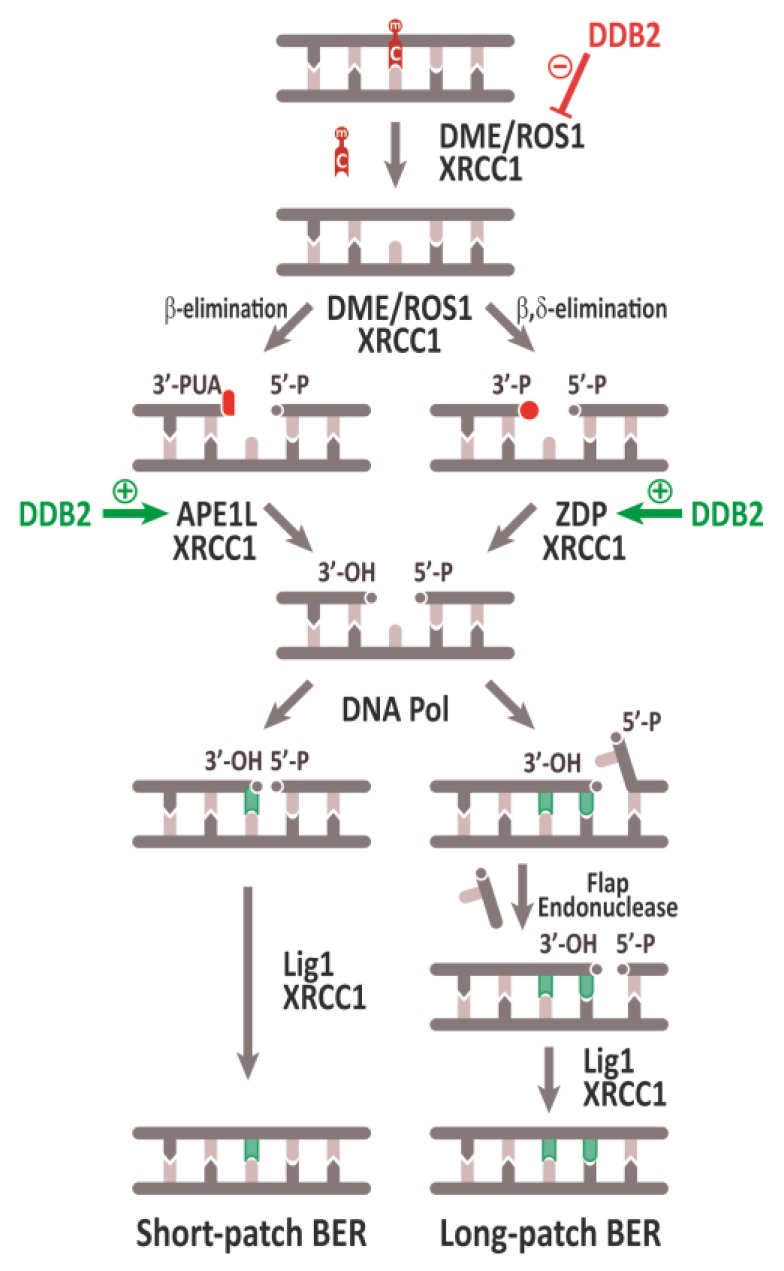
Figure 2.
Schematic representation of the active DNA demethylation pathway in Arabidopsis. Different 3’ blocked ends are indicated in red. Stimulatory or inhibitory effect of DDB2 over different proteins of active DNA demethylation pathway are indicated with green or red arrows, respectively. See text for details.

