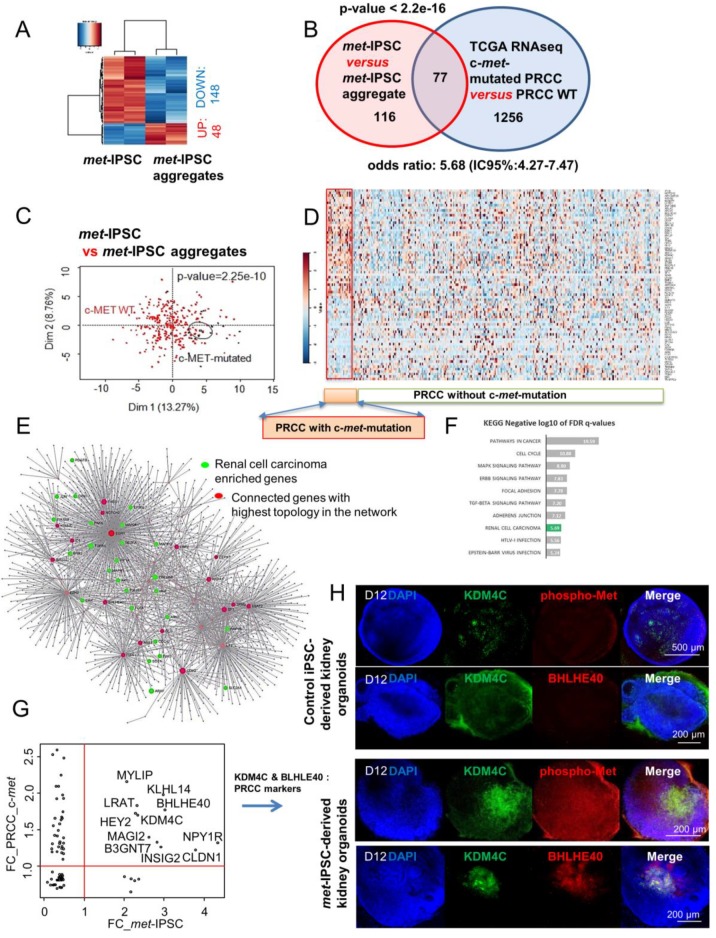
Figure 6.
Transcriptome analyses of met-IPSC aggregates. (A) Expression heatmap (Euclidean distances) of differential expressed genes found between met-IPSC (monolayer culture) and met-IPSC aggregates. (B) Venn diagram of the meta-analysis between met-IPSC and PRCC patient analysis, p-value of the met-IPSC signature in PRCC expression profile was calculated by hypergeometric test of Fisher. (C) Principal component analysis performed with meta-analysis gene intersection (77 genes) on PRCC tumor samples (Z-scores RNA-seq V2), p-value was calculated by correlation of the group discrimination of the first principal component. (D) Expression heatmap performed with meta-analysis gene intersection (77 genes) on PRCC tumor samples. (E) protein-protein interaction network built with the projection of 77 meta-analysis genes on innateDB interaction database: red genes represent connected genes with the highest topology in the network, green genes represent enriched gene during Kyoto Encyclopedia of Genes and Genomes (KEGG) inference and related to the Renal cell carcinoma. (F) Bar plot representing negative logarithm base 10 of False Discovery Rate (FDR) q-values found during functional inference of KEGG database on meta-analysis protein-protein interaction (PPI) network. (G) Concordance scatterplot of fold-change (FC) found during meta-analysis of transcriptome. The x-axis shows FC of the genes found in met-IPSC transcriptome study and the y-axis shows the FC of genes found in analysis of PRCC RNA-seq study. The genes found to be expressed > 1 FC are shown by their gene symbols. (H) Whole-mount immunostaining for KDM4C (Lysine demethylase 4C), phospho-Met and DAPI in kidney embryoid bodies.

