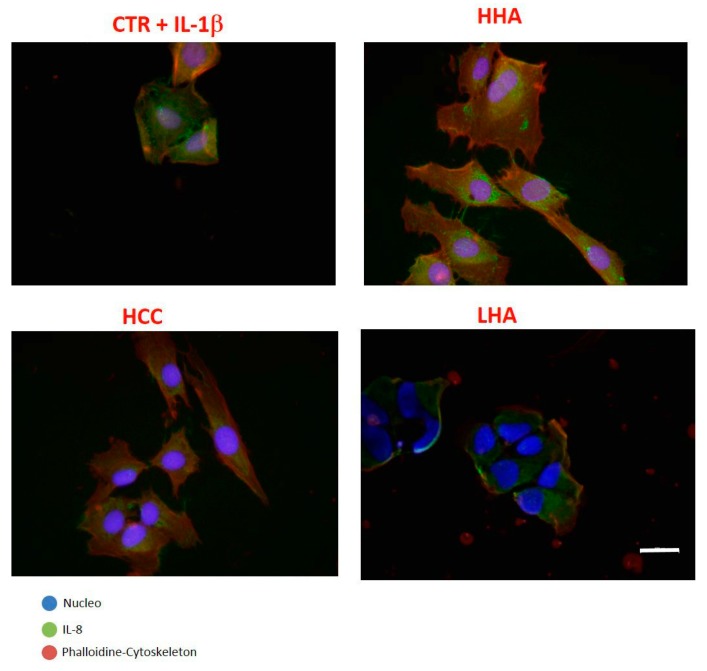
Figure 5.
Expression of IL-8 in HaCat/HDF co-culture. Cells were stimulated with IL-1β for 2 h and then treated with HHA, LHA, and HCC at 0.4% w/w, as well as a control for comparison. Images were taken 24 h after treatment. The panels show triple immunofluorescence analysis for cytoskeleton (red), nucleus (blue), and interleukin (green). In the presence of HCCs, the expression of IL-8 decreased. Scale bar represents 100 μm.

