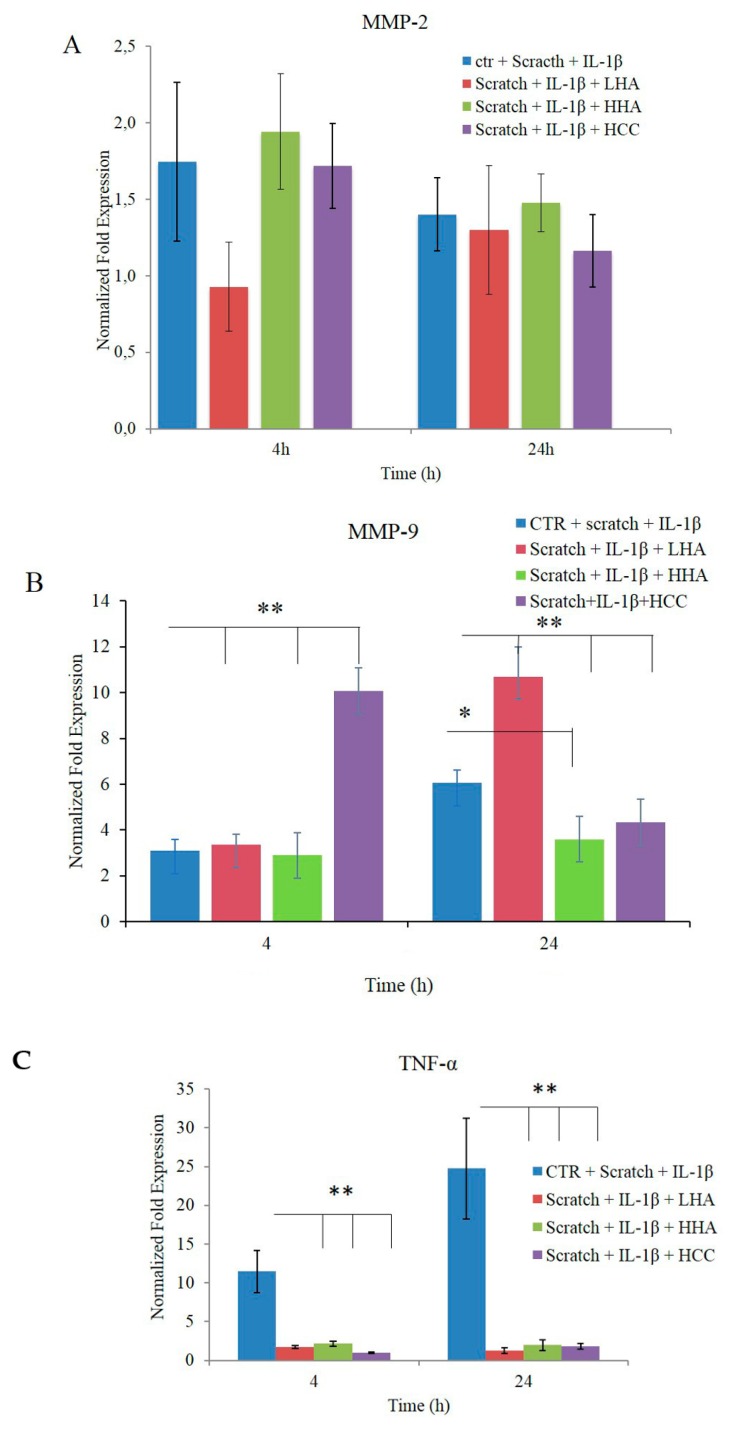
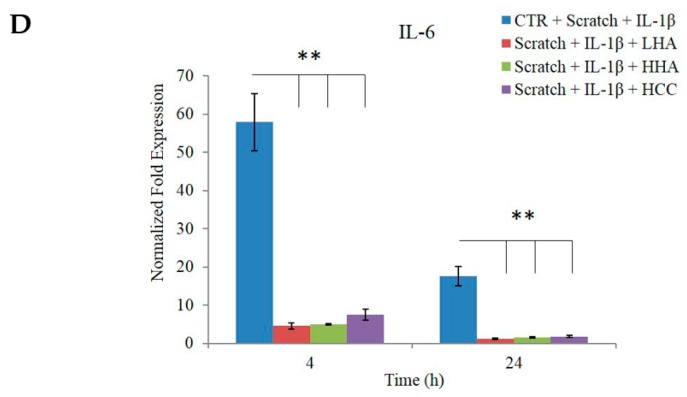
Figure 7.
Effects of LHA, HHA, and HCC on mRNA expression in HaCaT/HDF co-cultures in comparison with a control sample. The HaCaT/HDF cells were scratched and stimulated with IL-1β for 2 h in DMEM with 10% FBS, and then treated with HA and its complex. Data are presented as mean ± SD. At 4 and 24 h, the total RNA was extracted and qRT-PCR was performed to determine the gene expression of (A) MMP-2, (B) MMP-9, (C) TNF-α, and (D) IL-6. *p < 0.01 for LHA, HHA, and HCC vs. control (CTR) at 4 h or LHA and HCC vs. CTR at 24 h; **p < 0.05 for HHA vs. CTR at 24 h.


