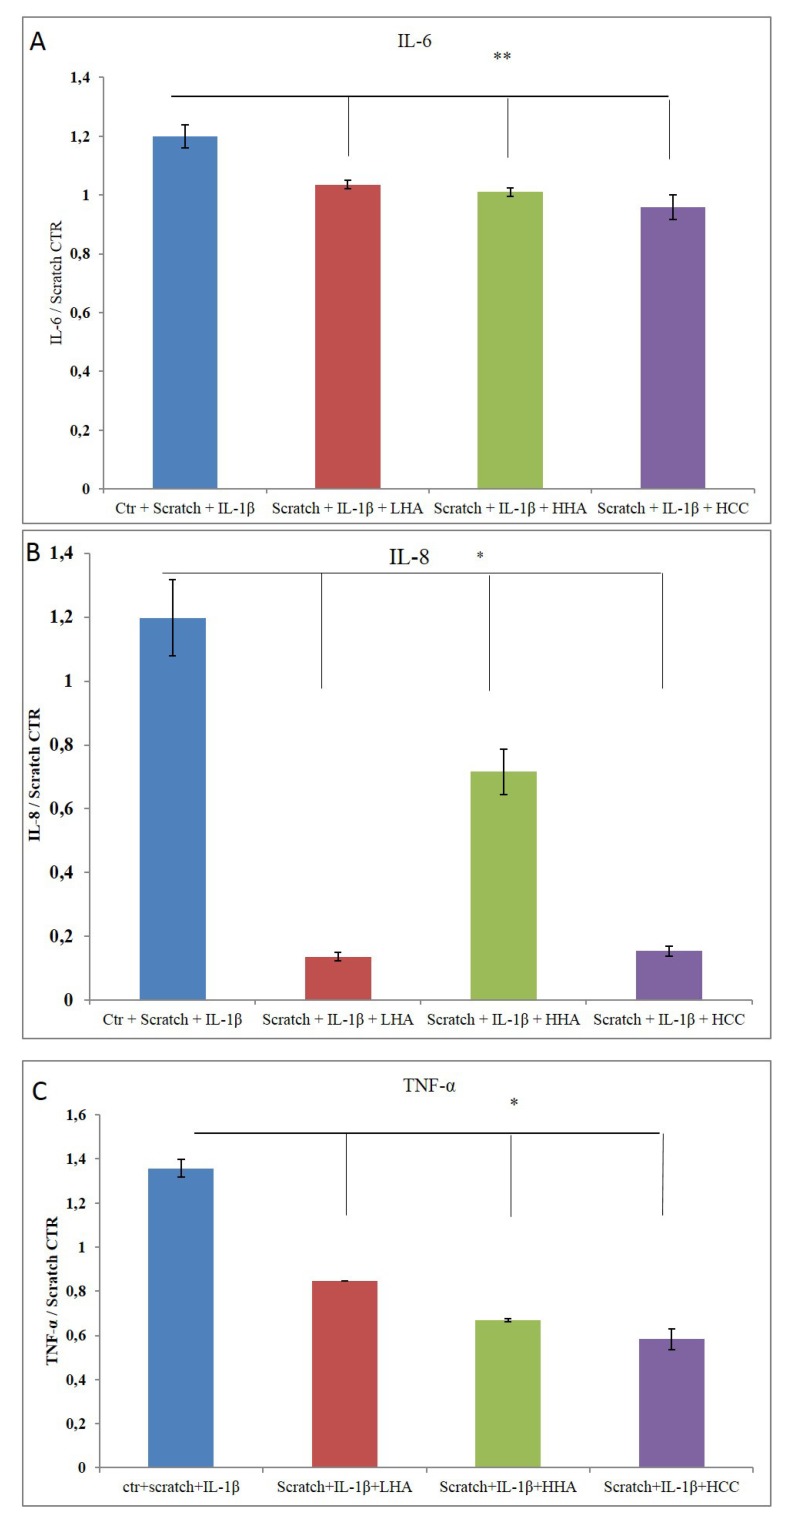
Figure 8.
Quantification of cytokines. (A) TNF-α, (B) IL-6, and (C) IL-8 were evaluated using Bio-plex. The data were normalized with respect to the scratch control (CTR) and reported as ratios of protein concentration (pg/mL) as mean ± SD. *p < 0.01 for HCC, HHA, and LHA vs. CTR in (A); p < 0.05 for HCC vs. CTR in (B); or p < 0.01 for HCC, HHA, and LHA vs. CTR in (C).

