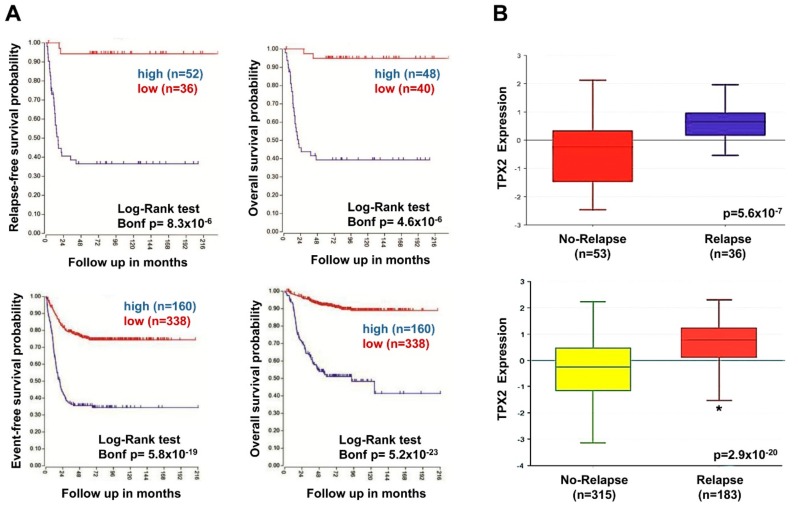
Figure 6.
Neuroblastoma patient outcomes based on TPX2 expression. (A) Using the neuroblastoma Versteeg (top) and SEQC (bottom) patient datasets in the R2 Genomics Analysis and Visualization Platform (http://r2.amc.nl), patients were divided into high (blue) and low (red) TPX2 gene expression groups and survival curves were generated. Relapse-free survival (top left), event-free survival (bottom left) and overall survival (right) curves are shown with patient numbers in parentheses. (B) Relative TPX2 expression levels were plotted for patients without and with relapse from the Versteeg (top) and SEQC (bottom) patient data sets, with patient numbers shown in parentheses (* p < 0.05).

