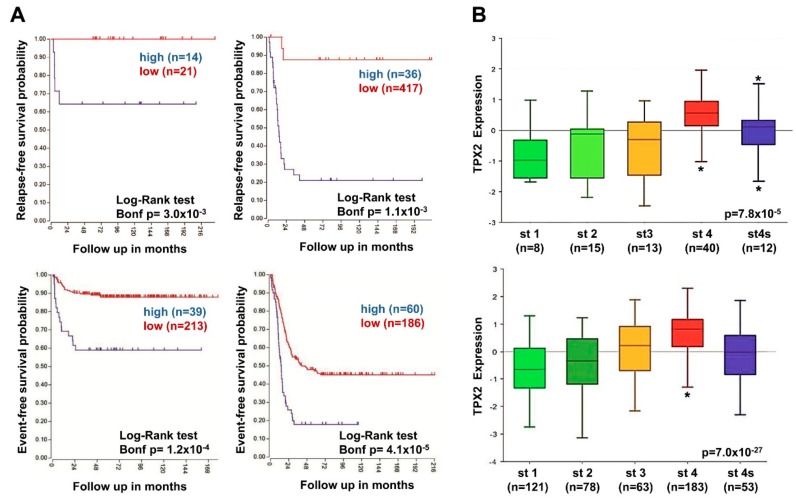
Figure 7.
Neuroblastoma patient outcomes based on TPX2 expression and disease stage. (A) Using the neuroblastoma Versteeg (top) and SEQC (bottom) patient datasets, survival curves were generated for patients with stage 1, 2, and 4S tumors (left) and with stage 3 and 4 tumors (right). Relapse-free survival (top) and event-free survival (bottom) curves are shown, with patient numbers in parentheses. (B) Relative TPX2 expression levels from the Versteeg (top) and SEQC (bottom) patient data sets were plotted in patients with disease stage (st) 1, 2, 3, 4, and 4S, respectively, with patient numbers shown in parentheses (* p < 0.05).

