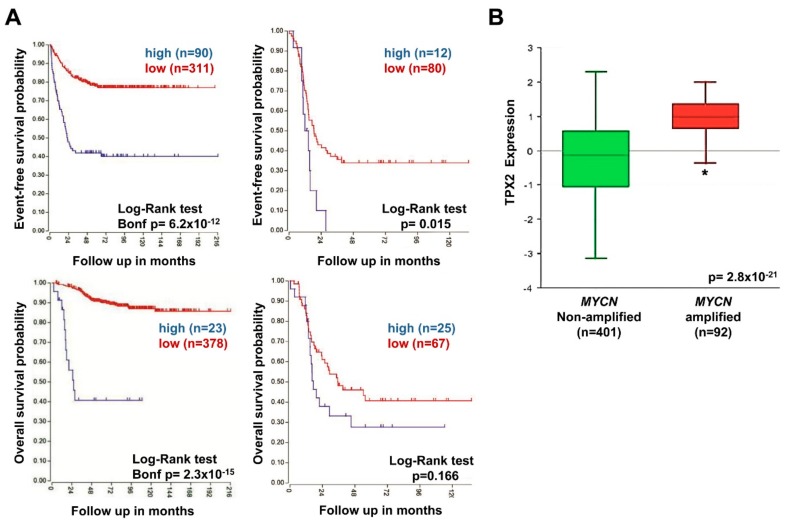
Figure 8.
Neuroblastoma patient outcomes based on TPX2 expression and MYCN amplification. (A) Using the neuroblastoma SEQC patient data-set in the R2 Genomics Analysis and Visualization Platform (http://r2.amc.nl), patients were divided into high (blue) and low (red) TPX2 gene expression groups by median-centered Log2 ratios and survival curves were generated for patients with MYCN non-amplified tumors (left) and with MYCN amplified tumors (right). Event-free survival (top) and overall survival (bottom) curves are shown, with patient numbers in parentheses. (B) Relative TPX2 expression levels were plotted in patients with MYCN non-amplified and amplified tumors (* p < 0.05).

