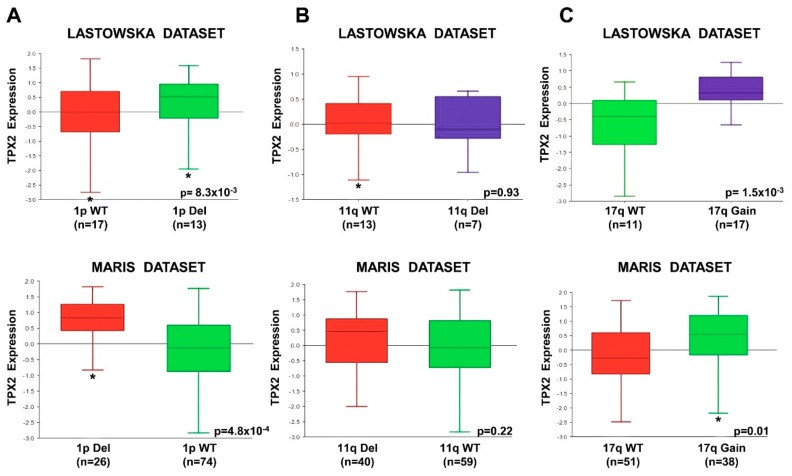
Figure 9.
TPX2 Expression Compared to Chromosome 1p, 11q, and 17q status. Using the R2 Genomics Analysis and Visualization Platform, TPX2 gene expression in the Lastowska (upper) and Maris (lower) data sets was compared in patients with wild-type chromosome 1p or with 1p deletion (A), in patients with wild-type chromosome 11q or with 11q deletion (B), and in patients with wild-type chromosome 17q or with 17q gain (C). Patients’ numbers are shown in parentheses. (WT = Wild Type; Del = Deletion) (* p < 0.05).

