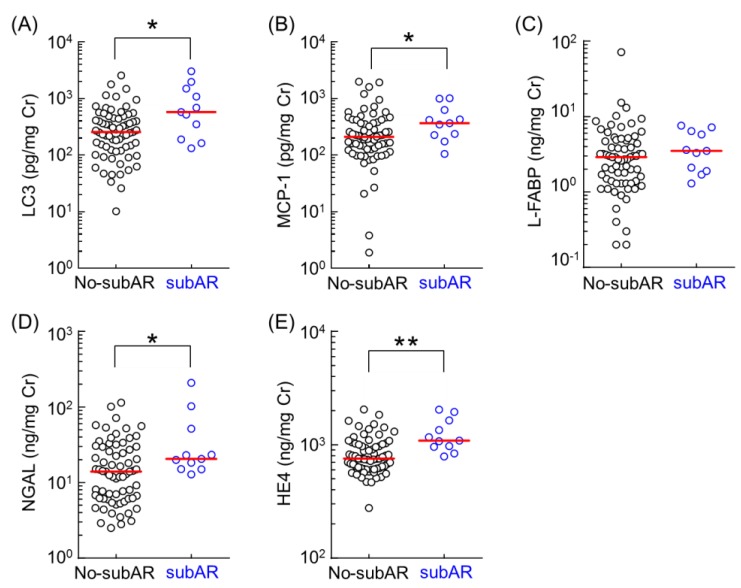
Figure 1.
Comparison of the urinary levels of LC3 (A), MCP-1 (B), L-FABP(C), NGAL (D), and HE4 (E) between the no-subAR group (n = 69) and subAR groups (n = 11). Data were obtained from urinary samples collected 3 months after kidney transplantation. Bar shows the median value in each group. Data were normalized to urinary creatinine concentration and plotted on a logarithmic Y axis. Statistical analyses were performed using the Mann–Whitney U test. * p < 0.05, ** p < 0.01.

