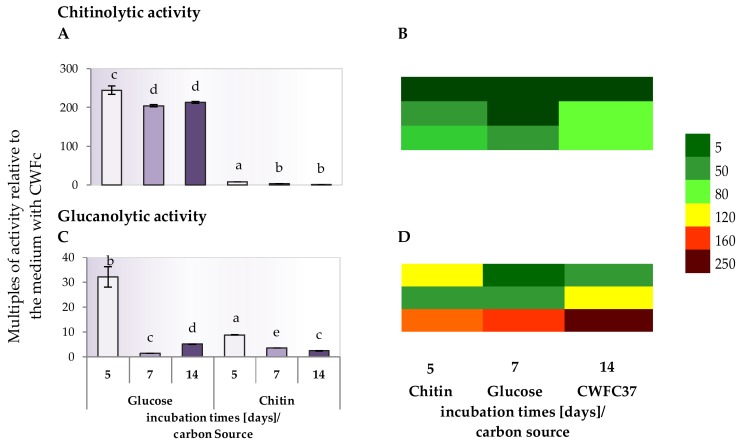
Figure 7.
The multiples of chitinolytic (A) and glucanolytic (C) activity of Trichoderma DEMTkZ3A0 strain on medium supplemented with lyophilized cell wall of the pathogenic F. culmorum strain (CWFC37) relative to the medium with glucose or chitin. Heatmap allows to compare chitinolytic (B) and glucanolytic (D) activity on three carbon sources: Glucose, chitin and after 5, 7, and 14 days of incubation. The color scheme of the heat map fields represents the concentration in µg/mL.

