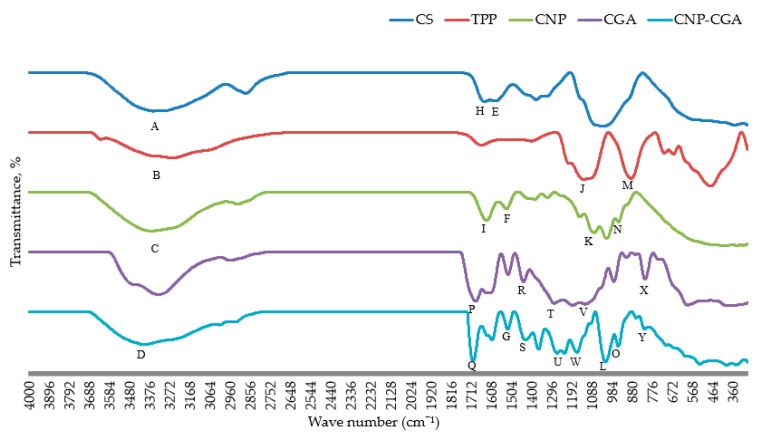
Figure 9.
FTIR spectra of CS, TPP, CNP°, CGA, and CNP°-GCA. The successful formation of CNP° and CNP°-CGA were discerned through the presence of functional group peaks. Freeze dried samples were used to ensure sensitivity of analysis, also to remove non-specific background peaks. Alphabet labeling denotes important functional groups of samples, and is further elaborated in Table 3.

