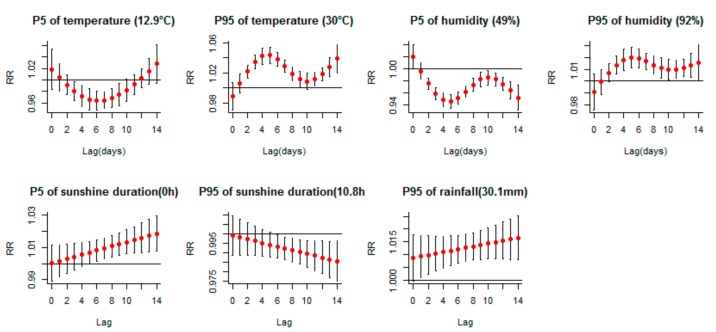
Figure 3.
Lag-response curves for P5, P95 of meteorological variables on HFMD occurrence (5th percentile of rainfall was 0 mm, the same with the reference value, so the effect of 5th percentile of rainfall was not shown). The red points are the relative risks (medians as references), and the black bars are 95% CIs. Shenzhen 2009–2017.

