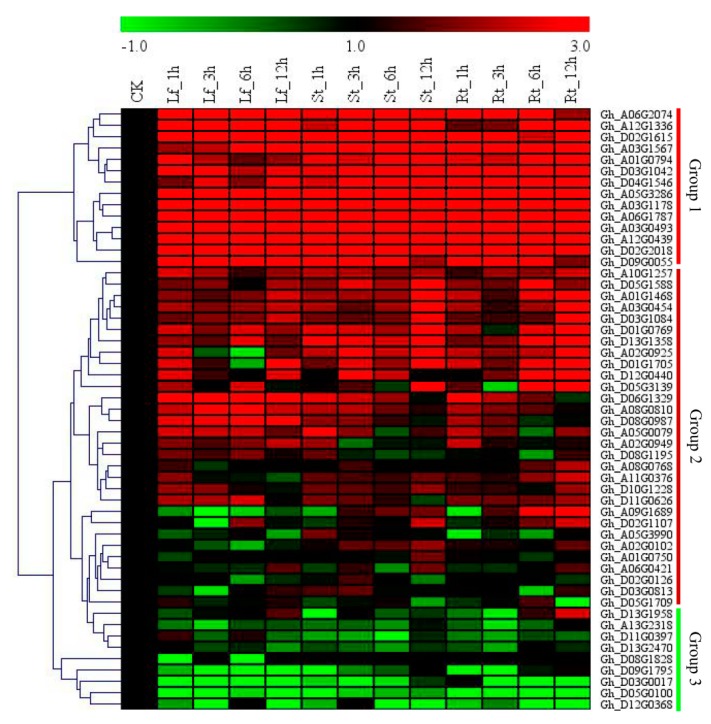
Figure 4.
Expression Analysis of the selected GhNLP genes. Cotton seedlings were grown in a hydroponic setup with a modified Hoagland nutrient solution, N-limited condition imposed by adjusting the N-content to 0.05 mM NO3− concentration, and normal N-condition maintained at 7.5 mM NO3− concentration. The leaf, stem and root tissues were harvested at 0 h, 1 h, 3 h, 6 h, and 12 h. RNA extracted and the expression levels of the 53 selected GhNLP genes analysed by RT-qPCR with GhActin as the internal control. The heat map was visualized using Mev.exe program (Showed by log 2 values). Red: Up-regulated, green: Down-regulated and black-no significant difference in expression levels compared to control (ANOVA, p < 0.05).

