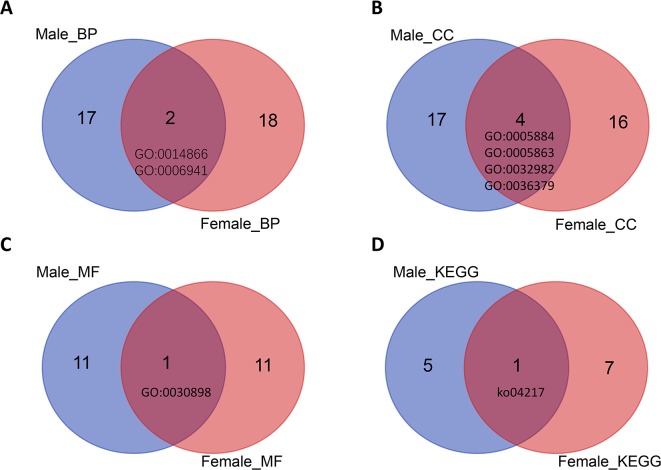
Figure 4.
Venn plots of GO terms and KEGG pathway terms for both male and female high-expression protein-coding genes. (A) Two BP term was enriched in male and female samples. (B) Four CC terms were enriched in male and female samples. (C) One MF term was enriched in male and female samples. (D) One KEGG term was enriched in male and female samples.

