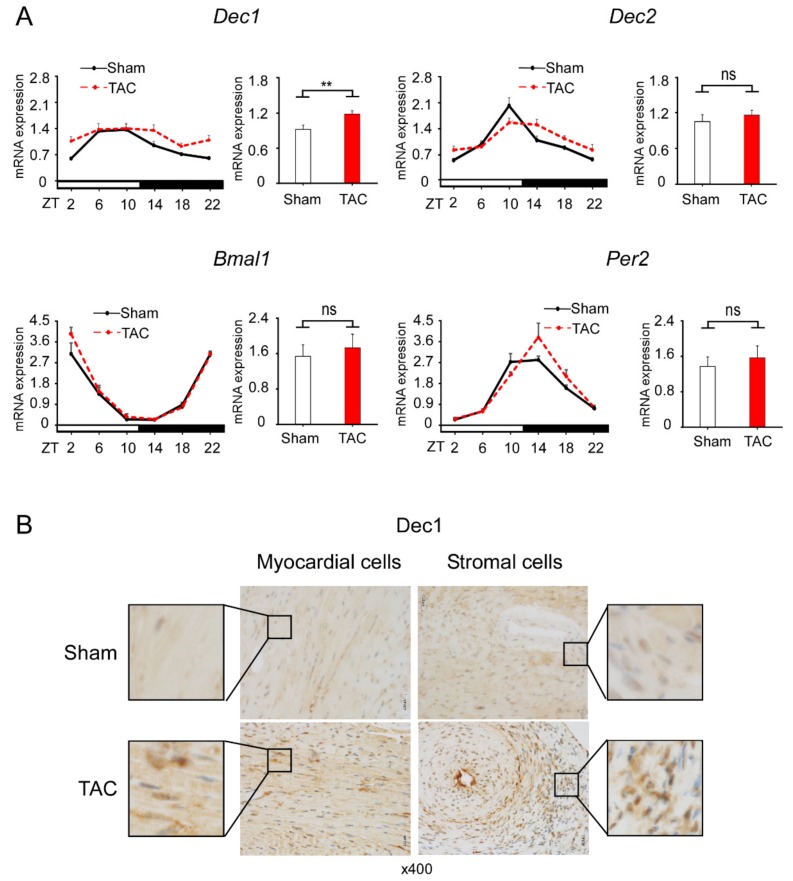
Figure 2.
TAC increases Dec1 expression. (A) The circadian expression of clock genes in WT mice treated with TAC (red dotted line) and sham treatment (black line). The mRNA levels of Dec1, Dec2, brain and muscle aryl hydrocarbon receptor nuclear translocator-like protein-1 (Bmal1), and period 2 (Per2) were analyzed by real-time PCR. Each right graph shows average of total mRNA expressions from zeitgeber time 2 (ZT2) to ZT22 in sham and TAC mice. The circadian expression of clock genes was assessed by analyzing one-way ANOVA. Multiple comparisons between sham and TAC groups were analyzed by two-way ANOVA with Tukey–Kramer post hoc test. Comparison of two groups was analyzed by a two-tailed Student’s t-test. The number of mice was four or five mice per group per time point. Data are the means ± SEM. ** p < 0.01; NS: not significant; ZT: zeitgeber time with light on at 8:00 a.m. (ZT0) and light off at 8:00 p.m. (ZT12). (B) Immunohistochemical detection of Dec1 in myocardial and stromal cells. Representative images of one WT heart treated with TAC and sham at four weeks. The black square shows representative large images, magnification 400×.

