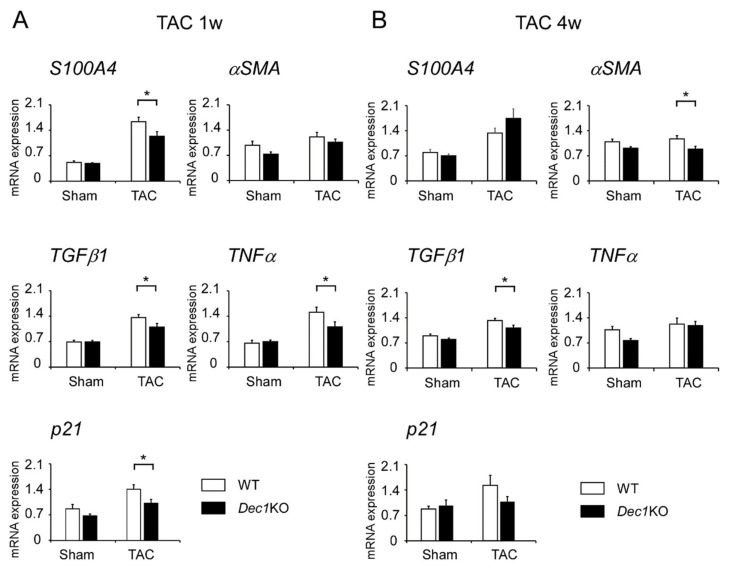
Figure 6.
Dec1 deficiency affects the mRNA expressions of S100A4, αSMA, TGFβ1, TNFα, and p21 after TAC. (A) The relative mRNA expression of S100A4, αSMA, TGFβ1, TNFα, and p21 in WT and Dec1KO hearts at one week after TAC (n = 11–13 mice per group) and sham treatment (n = 5–6 per group). The mean comparison between WT and Dec1KO mice after TAC and sham treatment was analyzed by a two-tailed Student’s t-test with 95% confident interval (CI). For TAC groups, the p-values were as follows: S100A4, 0.03 (95% CI: 0.0448, 0.7473); TGFβ1, 0.04 (95% CI: 0.0134, 0.5095); TNFα, 0.04 (95% CI: 0.0092, 0.7970); p21, 0.04 (95% CI: 0.0202, 0.7586). For sham groups, none were significant. The white box indicates WT, and the black box indicates Dec1KO. (B) Four weeks after operations (n = 8–11 mice per group). For TAC groups, the p-values were as follows: αSMA, 0.02 (95% CI: 0.0413, 0.5321); TGFβ1, 0.03 (95% CI: 0.0197, 0.3988). For sham groups, the p-value was as follows: TNFα, 0.01 (95% CI: 0.0656, 0.5337). Data are means ± SEM. * p < 0.05; NS: not significant.

