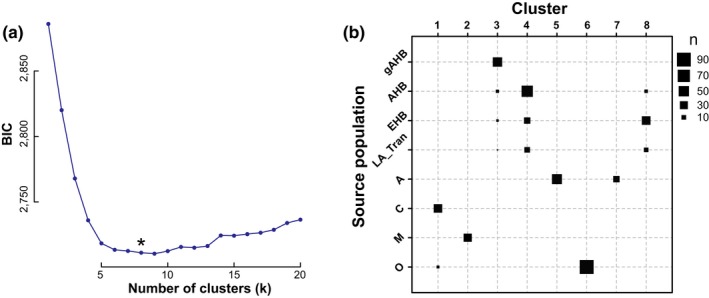
Figure 1.

Identification of unsupervised genetic clustering via k‐means selection. a, Plot of the Bayesian information criteria (y‐axis) used to select the optimal number of possible genetic clusters (x‐axis) in our data set. A k = 8 number of clusters was optimal for this data set (highlighted by an asterisk). b, The plot illustrates relationship of cluster memberships between prior population clusters (y‐axis) and derived unsupervised genetic clusters (x‐axis) for the data set. Square size indicates number of samples as defined in the legend
