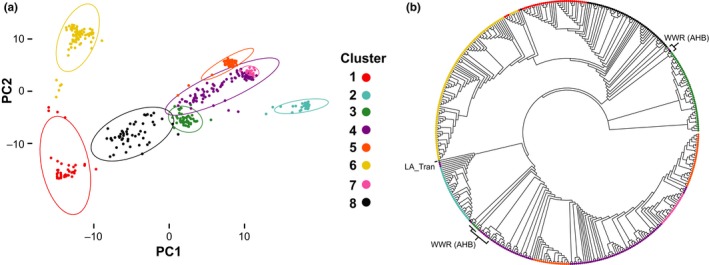
Figure 3.

Structure clusters derived from genetic similarity across the data set. a, Principal components analysis (PCA) of the data set. b, Neighbor‐joining tree plotted as an unrooted cladogram of the same data set used to explore genetic relationship between samples and its correlate with cluster assignation. Specific labels are provided for a subset of nine samples from continental hybrid populations (WWR, Latin American Transect) grouped in the same cluster as all the gAHB samples. In both panels colors are provided to highlight the previously defined genetic clusters (as in Methods 2.4, also in Figure 1b)
