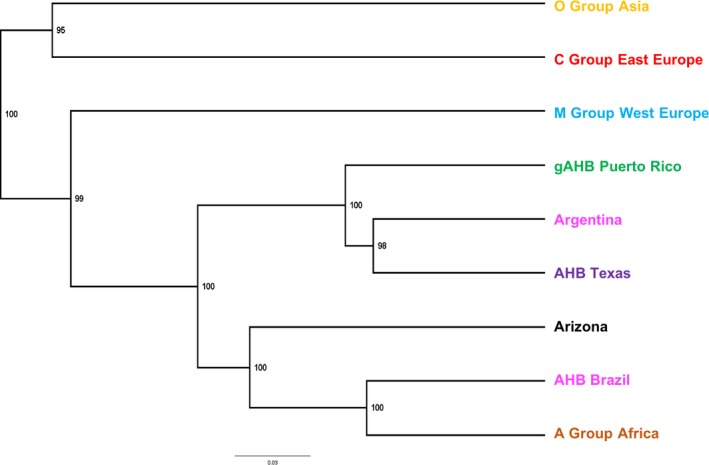
Figure 4.

UPGMA Dendrogram. Tree based on genetic distances of Nei (1987) for different populations of Apis mellifera analyzed in the world, including gAHB. Colors are provided for visual representation and correspond to the cluster (Methods 2.4, Figure 1 & 3) where the majority of samples from each of the populations was assigned
